
When faced with a large windfall, most investors naturally rely on Dollar Cost Averaging (DCA) to gradually invest their portfolio. The touted benefits of DCA are usually (1) avoiding a large market decline right after investing and (2) buying more shares when prices are lower.
Academic and industry research, however, has shown that just investing right away (Lump Sum Investment or LSI) is generally the superior strategy when looking at returns or even risk-adjusted returns. But since DCA remains quite popular with both individual investors and investment professionals, we must wonder when this investment strategy makes sense.
First, let’s look at the average returns earned by employing DCA vs Lump Sum Investment when investing in US stocks. Let’s consider DCA over 4 time periods: equal monthly investments over 6 months, 1 year, 2 years, and 5 years.
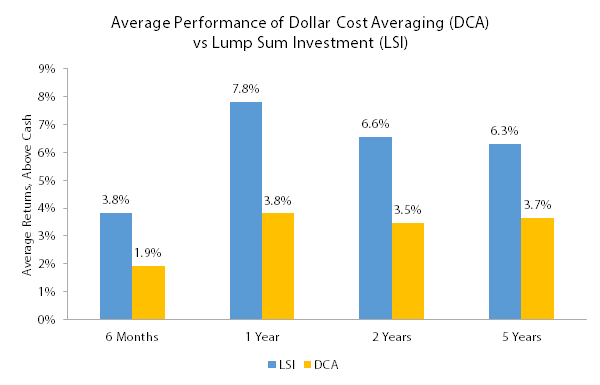
Note: Returns are based on S&P 500 data from 1/1928 to 4/2013. Returns over 1 year are annualized.
Why are returns for DCA so much lower than LSI? Primarily because DCA is not fully invested in an investment that, on average, earns a higher return than cash. This difference in performance can be considered the cost of following DCA instead of LSI. If we ended our analysis here, DCA looks like a strategy that is quite costly to follow.
To explore this further, let's add a market factor I frequently rely on: valuations using P/E ratios. When valuations are high and expected stock returns are low, perhaps the performance costs of DCA would drop. The following table shows the performance gap between LSI and DCA, grouped by initial P/E.
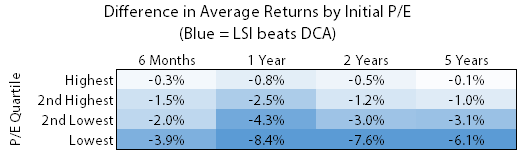
Note: Returns are based on S&P 500 data from 1/1928 to 4/2013. Returns over 1 year are annualized. P/E ratios use 20 years of earnings.
Since stock returns are highest when valuations are low, the performance costs of DCA are most significant under those conditions. When P/E ratios are high, the costs of DCA are much lower.
Comparing risk-adjusted returns below, DCA actually beats LSI when P/E ratios are high. When P/E ratios are low, the cost of using DCA remains high on a risk-adjusted basis, especially for longer periods.
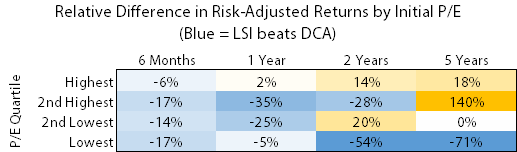
Note: Risk-adjusted returns are calculated as Sortino ratios using S&P 500 data from 1/1928 to 4/2013. P/E ratios use 20 years of earnings.
To determine how and when to use Dollar Cost Averaging, you should weigh the behavioral and risk benefits against the performance costs. And performance costs depend largely on valuations.
When valuations are low, the performance costs of DCA are high. Stick with Lump Sum Investment if you’re comfortable, or limit your DCA time period to less than a year to minimize the cost in performance.
When valuations are high, costs of DCA are much lower. Feel free to use DCA even over periods longer than a year.
And where are we today? As of 6/25/2013 with the S&P 500 around 1,588, the current P/E ratio is in the highest quartile. Feel free to DCA.