
The other day, I introduced three online investment services and evaluated them versus a target date fund. As promised, this post goes a little deeper into the asset allocations recommended by these services.
This glide path chart is where I left off:
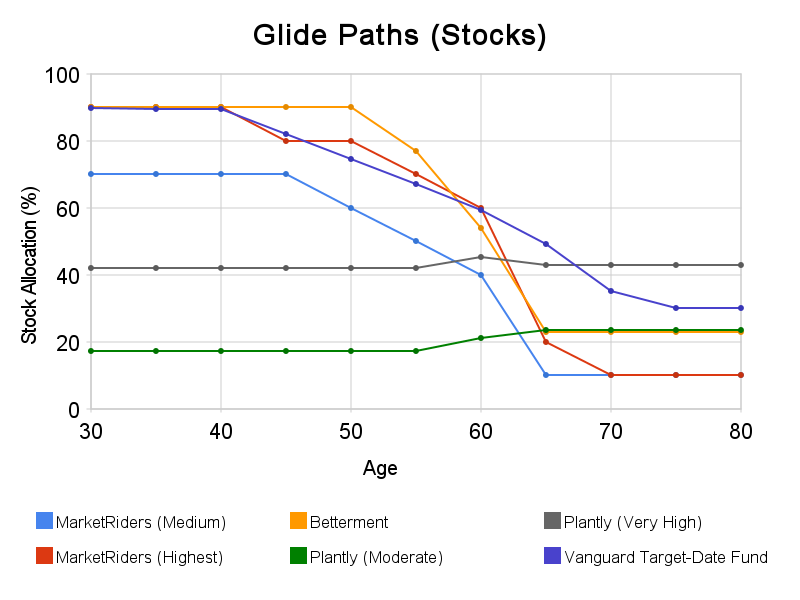
Source: MarketRiders, Betterment, Plantly, Vanguard, and Mariposa calculations during week of 8/23/2010
Before getting into the differences, let’s discuss the similarities first.
All three seem to base their recommendations, at least loosely, on the principles of modern portfolio theory. This theory assumes that investors prefer lower risk for the same return and higher return for the same risk. And one way to reduce risk with no or minimal reduction in returns is to diversify into multiple asset classes. So deciding on that optimal mix of asset classes (the asset allocation) becomes a critical step in investing.
Another similarity is that all use discrete portfolios. It’s hard to tell in the chart above, but the recommended portfolios jump from one to the next depending on your questionnaire responses. For example, one portfolio may recommend 10% in bonds, while the next recommends 20%; there are no portfolios in between to smooth out this change.
Even though the services may choose your portfolio from hundreds of possibilities, hundreds is not enough to prevent occasional, large changes in your portfolio. MarketRiders and Betterment do allow gradual changes in the form of manual overrides, but not with their portfolio recommendations.
Now let’s contrast the specific asset allocations recommended by these services using the same hypothetical investor who is 30 years old, is looking to retire at 65, has $50,000 to invest, and has a moderate risk preference.
Keep in mind that this is only one example. These services obviously tailor their portfolios to your questionnaire responses, so the portfolio you end up with may look very different from these.
MarketRiders
The type of diversification found here is probably closest to what I am used to. Beyond what typical investors own, there’s exposure to real estate (REITs), commodities, and foreign stock markets.
The results do not seem to depend on current market conditions, nor does it look like the output of a quantitative optimization. The benefit is that its portfolios are stable over time, avoiding unnecessary changes due to quirks in the market data or optimization. However, it is passing on the opportunity to use all available information to produce more optimal portfolios.
| Ticker | ETF Name | Asset Class | Allocation (Medium Risk) | Allocation (Highest Risk) |
| VTI | Vanguard Total Stock Market ETF | US Stocks | 31.0% | 40.0% |
| VEU | Vanguard FTSE All-World ex-US ETF | Foreign Stocks | 21.5% | 28.0% |
| RWR | SPDR Dow Jones REIT | US Real Estate | 12.5% | 15.0% |
| IXC | iShares S&P Global Energy | US Commodity Stocks | 2.5% | 3.5% |
| GLD | SPDR Gold Shares | Commodities | 2.5% | 3.5% |
| BND | Vanguard Total Bond Market ETF | US Bonds | 24.0% | 5.0% |
| TIP | iShares Barclays TIPS Bond | US Inflation-Protected Bonds | 6% | 5.0% |
Betterment
Betterment’s allocation is somewhat untraditional. It overweights small cap and value stocks within the US which I don’t necessarily have a problem with, but it has no exposure at all to foreign stocks or real estate.
Further, it includes two ETFs to capture large cap value stocks, and includes a highly concentrated ETF in DIA to capture large cap stocks. The Dow Jones average is a popular index, but it’s not well-suited for investment since it only contains 30 stocks–and it’s price weighted!
Finally, Betterment only uses TIP for bonds, completely ignoring regular Treasury bonds.
Like MarketRiders, the results do not seem to depend on current market conditions, nor does it look like the output of a quantitative optimization.
| Ticker | ETF Name | Asset Class | Allocation |
| VTI | Vanguard Total Stock Market ETF | US Stocks | 18.0% |
| DIA | SPDR Dow Jones Industrial Average | US Large Cap Stocks | 9.0% |
| IVE | iShares S&P 500 Value Index | US Large Cap Value Stocks | 18.0% |
| IWD | iShares Russell 1000 Value Index | US Large Cap Value Stocks | 18.0% |
| IWS | iShares Russell Midcap Value Index | US Mid Cap Value Stocks | 13.5% |
| IWN | iShares Russell 2000 Value Index | US Small Cap Value Stocks | 13.5% |
| TIP | iShares Barclays TIPS Bond | US Inflation-Protected Bonds | 10.0% |
Plantly
First off, remember that Plantly is in private beta and is not intended for real investment yet. However, the portfolio it recommends is quite untraditional. Unless you pick the highest risk setting, a 30 year old would have no exposure to US stocks. And the overall level of stock exposure seems much lower than expected.
Unlike the other two, Plantly does consider market conditions and uses an optimization algorithm, so your recommended portfolio may change over time without changes to the questionnaire. If you’re interested, you can read about its methodology and why its algorithm relies on (long) bonds so heavily.
It seems its algorithm is picking asset classes that are as different as possible, ignoring everything in between, and using cash for the rest. Although I agree with that idea to a point (I use Treasury bonds, instead of all bonds; I use REITs instead of home builder stocks), it’s taken beyond my comfort level.
From the outside, it seems a lot of confidence is being placed on its quantitative optimization. However, without a clear look at its secret algorithm, it is difficult to evaluate it properly.
| Ticker | ETF Name | Asset Class | Allocation (Moderate) | Allocation (Very High) |
| SPY | SPDR S&P 500 | US Large Cap Stocks | 0.0% | 4.0% |
| VWO | Vanguard Emerging Markets Stock ETF | Emerging Market Stocks | 17.3% | 38.2% |
| TLH | iShares Barclays 10-20 Year Treasury Bd | US Treasury Bonds | 45.7% | 57.8% |
| SHV | iShares Barclays Short Treasury Bond | Cash (roughly) | 36.9% | 0.0% |
Target Date Fund (Vanguard)
Vanguard’s target date fund is old-fashioned, but dependable. Diversification into real estate and foreign stock markets is nonexistent or limited. However, this is probably very close to the portfolio that typical investors expect for a young person saving for a retirement that is decades away.
Like MarketRiders and Betterment, the results do not seem to depend on current market conditions, nor does it look like the output of a quantitative optimization.
| Ticker | Fund Name | Asset Class | Allocation |
| VTSMX | Vanguard Total Stock Mkt Idx | US Stocks | 71.9% |
| VEURX | Vanguard European Stock Index | Foreign Developed Market Stocks | 8.9% |
| VPACX | Vanguard Pacific Stock Index | Foreign Developed Market Stocks | 4.7% |
| VEIEX | Vanguard Emerging Mkts Stock Idx | Emerging Market Stocks | 4.6% |
| VBMFX | Vanguard Total Bond Market Index | US Bonds | 9.9% |
Final Thoughts
All three services beat target date funds in terms of customizing asset allocations to the investor. The main draw of target-date funds is that future asset allocation changes and all rebalancing trades are done automatically and gradually. In exchange, you give up any form of customization.
MarketRiders comes closest to providing a fully diversified portfolio, however its default risk level (medium) seems to be set too low and changes happen too rapidly around retirement age. One way Plantly and Betterment could get users more comfortable with their untraditional recommendations is by being more open with the research and algorithm that produced them.