
From the February 2010 newsletter:
Today, I introduce you to a stock market valuation metric called Q popularized recently by economist Andrew Smithers. Q is defined as the ratio between the value of companies according to the stock market and their net worth measured at replacement cost. Extremely high values for Q indicates that the stock market is too high relative to its replacement cost, leading to lower future returns as the market corrects. A low value for Q indicates a stock market that is too low relative to its replacement cost, leading to higher future returns.
Well, this sounds great in theory, but how has Q performed as a predictor of returns? What follows is a chart of Q for the US stock market vs the following 10-year return of the S&P 500 index starting from 1946.
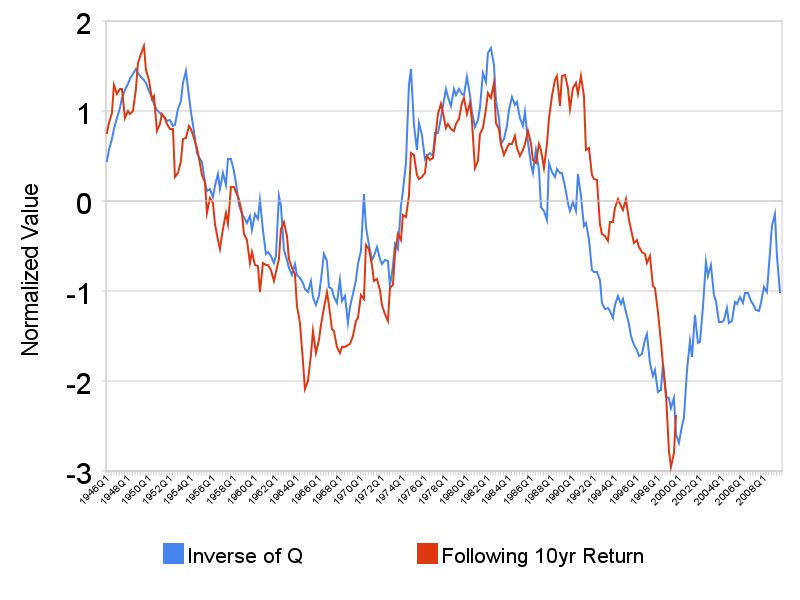
It seems that values for Q does a decent job of predicting future 10-year returns. For you stat-heads, the r-squared comes out to about 0.67.
How is this information used in terms of investment strategy? For very high levels of Q, I may recommend investing less in US stocks than your target allocation for new money. In certain situations, I may even recommend selling some investments in US stocks and waiting until valuations are more attractive. Even in these situations, allocations to US stocks would never be completely eliminated in order to keep turnover low, to minimize realized capital gains, and to mitigate the risk of Q not performing as expected.
Considering its track record as a predictor of stock market returns, why is Q not more popular? Some of my guesses are:
- It does not reliably predict returns for individual companies. So Q does not help Jim Cramer any as he manically comments on Apple or Bear Stearns.
- It does not predict short-term market moves. In predicting 3-month or 1-year market moves, Q is pretty much useless. Unless the public, the media, and our industry stop focusing on such short-term time frames, we cannot expect ideas that work in the long-term to ever get the attention they deserve.
- Finally, there is not enough data. The US stock market is the only one with reliable data. And even in the US, the data only goes back to 1946 using the official source (Federal Reserve). Even though 60+ years sounds like a long time, it has only given us 2 market bottoms, 2 market tops, and 6 independent data points in terms of 10-year returns.
In future posts, I will introduce improvements to Q as well as other metrics. If you want to learn more about Q and other stock market valuation metrics, take a look at Andrew Smither’s Valuing Wall Street.
Trackbacks