
I am not a fan of active trading. It may be fun to trade like Jim Cramer, but I certainly would not bet my retirement or my kid’s college education on it. We already know mutual fund managers have a horrible record of beating the market, and that study only considers transaction costs and fund expenses! If we add taxes to the study, their performance would be even worse.
So let’s explore the costs of active trading, specifically transactions costs and taxes. The following chart shows the effect of those costs based on holding periods ranging from 3 months to 10 years under a few assumptions (see end of post).
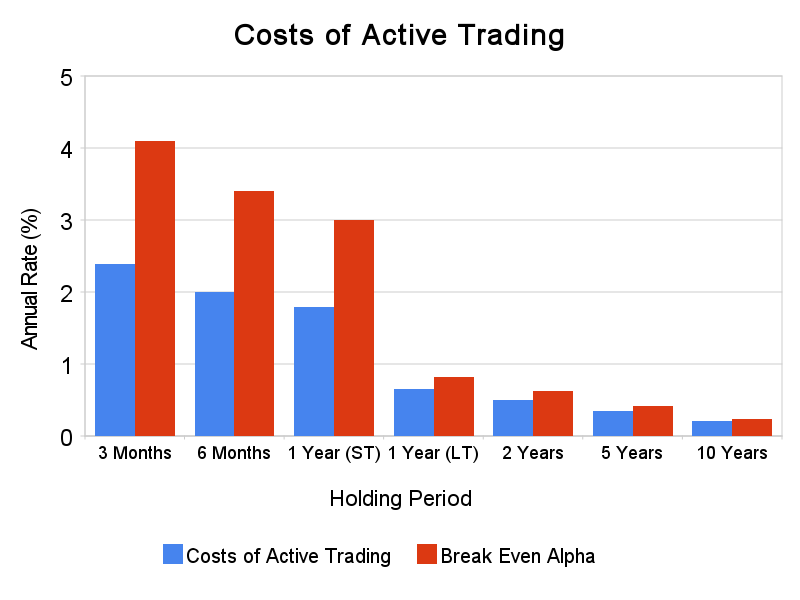
If you hold investments for less than a year, your annual costs due to trading are roughly 2%. However, the more important metric is the break even alpha, or how much you have to outperform to offset your trading costs. Break even alphas are higher than trading costs, because part of the outperformance is lost to taxes. Break even alphas for short-term trading is 3-4%, which is huge considering that mutual funds can’t even outperform to offset their fees of roughly 1 to 1.5%. Even if you hold investments for a few years, your break even alpha is still a large part of 1%.
From this, you can see that having a long-term strategy and limiting any market bets to a period of at least 5-10 years greatly enhances your chances for success. Just by doing that, you can expect to outperform your CNBC obsessed friends over the long term.
Assumptions:
- Costs and alphas are calculated vs a holding period of 20 years. Everyone needs to sell at some point!
- Total capital gains tax rates (federal + state) are 40% short term and 20% long term.
- Transaction costs are 0.3%, including commissions.
- Annual price return is 6% per year.