
From the September 2011 newsletter:
In prior newsletters, I made the case for using the P/E ratio to value the stock market and to predict future returns. Now let’s apply the same analysis to real estate, or more specifically REITs.
One crucial feature of REITs is that they are required to distribute almost all their income to maintain their tax status. This means earnings (the E in P/E) can be closely approximated by dividends. And dividend data is far easier to find for individual investors. Even better, the REIT industry provides historical data on their website for budding data scientists.
With a little data manipulation, you can create the chart below. “P/E” in this case uses 10 years of dividends, not earnings. The relationship we saw for stocks seems to hold again for real estate: P/E ratios using a longer horizon have a close, but not perfect, relationship with subsequent returns–in this case 2 year returns. High P/E ratios (blue line) tend to line up with below average returns (red line).
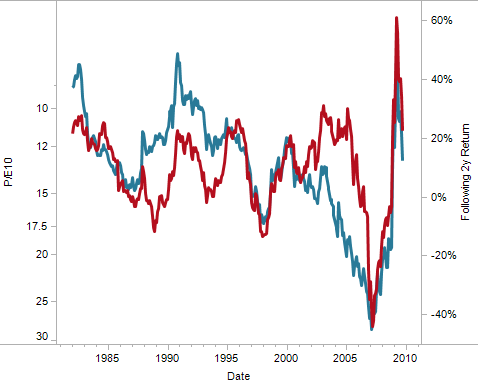
Source: REIT.com data and Mariposa calculations as of 9/28/2011.
Like stocks, this relationship does not work as well at shorter time periods (1 year or less). And below average returns for real estate can still be positive, weakening the case for using this analysis for short-term trading. As a result, my primary use is to make measured tactical adjustments vs strategic asset allocation targets, knowing that it may take years for the market to correct.
And how does the US REIT market look today? At Monday’s close (VNQ at $56.06), REITs look to be around 40% overvalued. It’s not alarming, but you should expect returns that are lower than the historical average.